Detailed Analysis Charts
Select an indicator above to view detailed chart
Click "View Detailed Chart" on any indicator card to see detailed analysis
April 2025
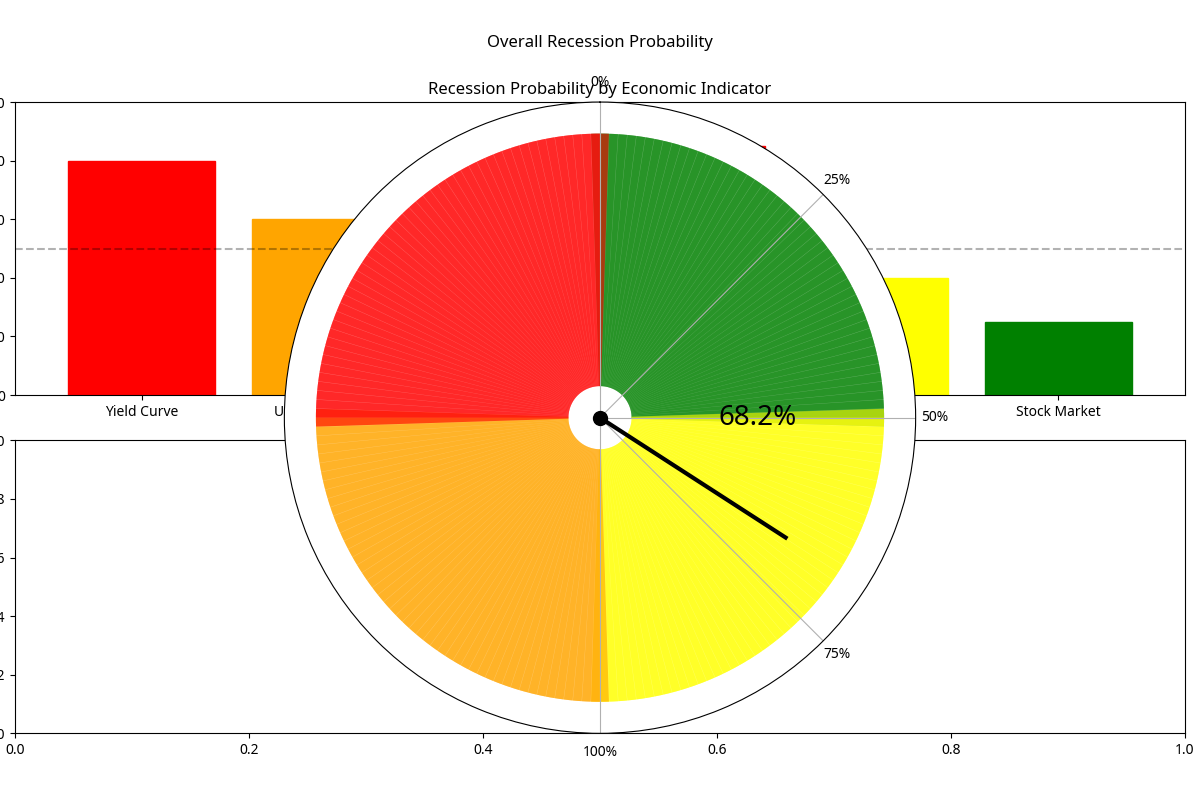
Probability of recession within the next 12 months
Based on a comprehensive analysis of key economic indicators, the probability of a recession in the United States within the next 12 months is estimated at 75.8%.
The most likely timeframe for recession onset is uncertain, but risks are elevated, with multiple indicators showing concerning signals that warrant close monitoring.
This assessment is based on a weighted analysis of six key economic indicators, with the yield curve, GDP growth, and unemployment rate showing particularly concerning trends. The recent normalization of the yield curve following an inversion, negative GDP growth in Q1 2025, and deteriorating consumer sentiment present a pattern consistent with pre-recession conditions.
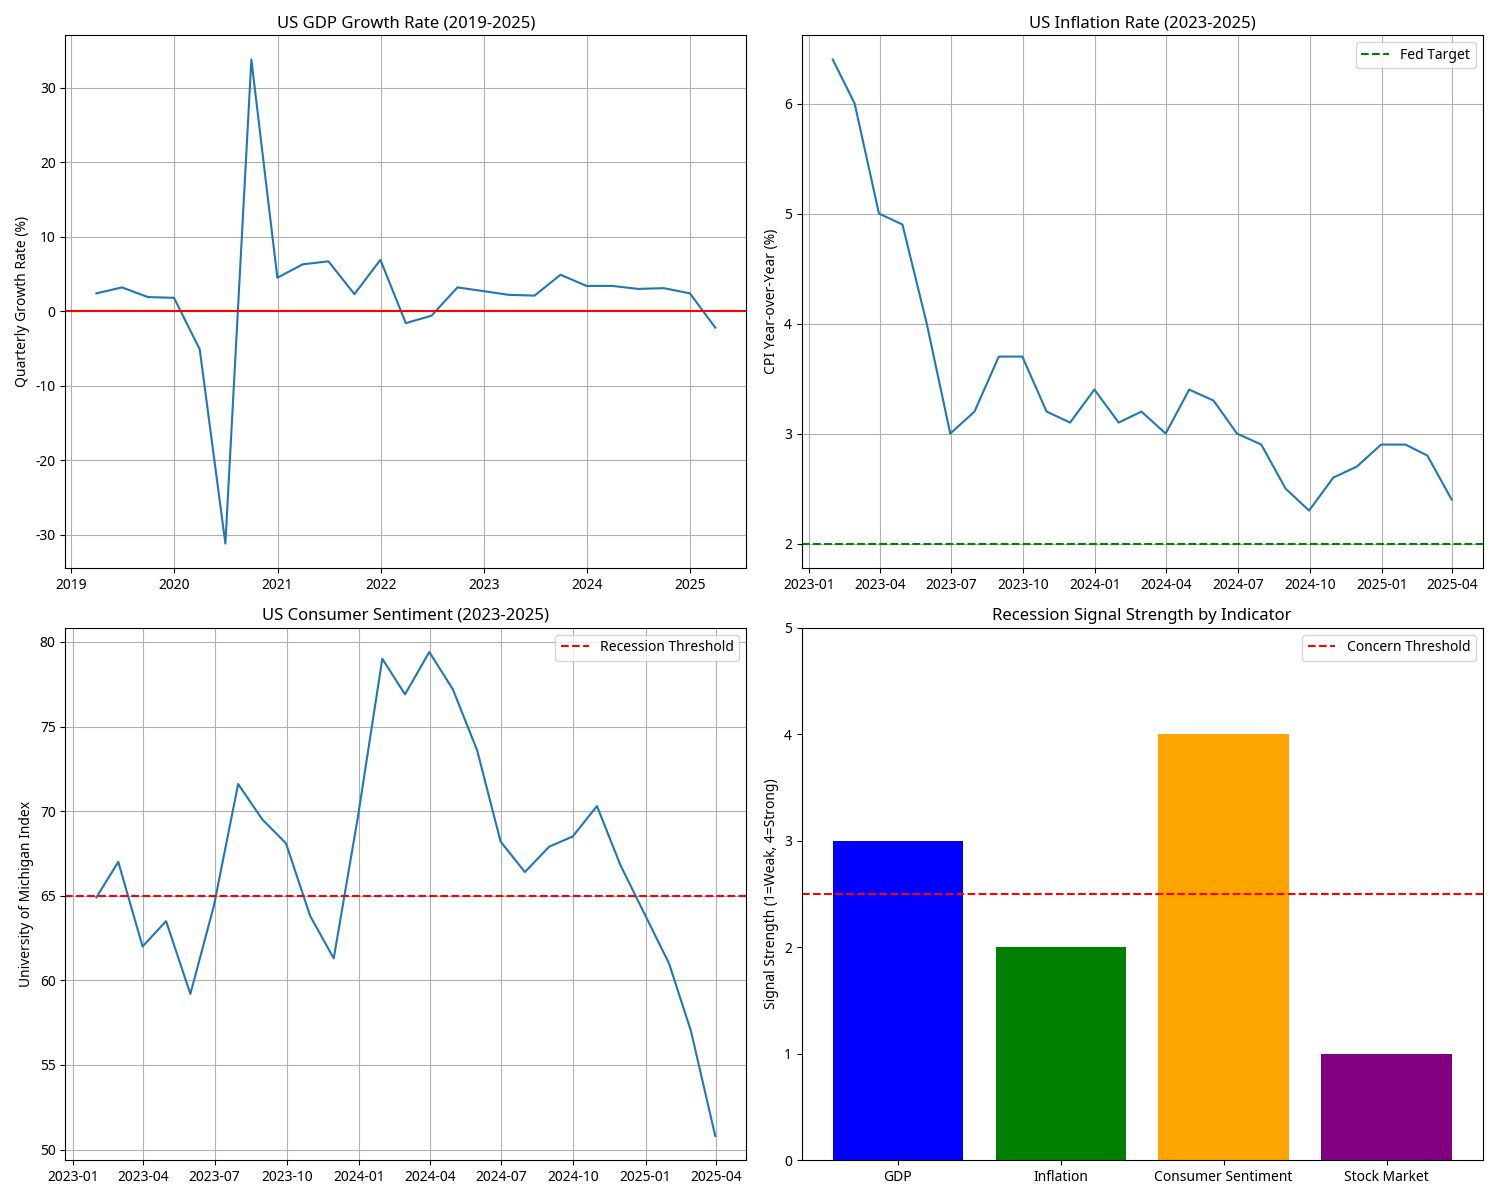
Our assessment weighs six key economic indicators based on their historical predictive power for recessions. The chart shows the recession probability signal strength for each indicator.
The strongest signals currently come from Consumer Sentiment (85%), Yield Curve (80%), and GDP Growth (75%), while Stock Market indicators (25%) show the least concerning signals.
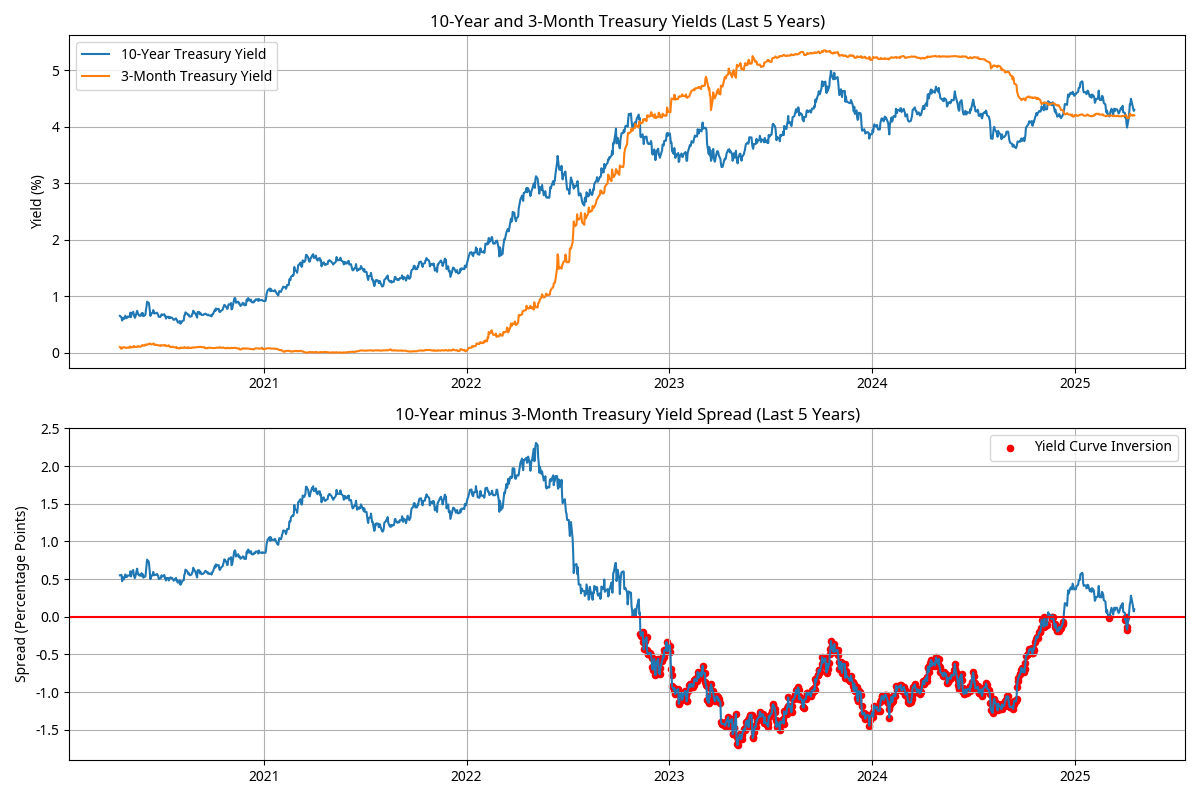
The yield curve (10-year minus 3-month Treasury yields) was recently inverted but normalized just 10 days ago, with the current spread at 0.10 percentage points.
This pattern of inversion followed by normalization has preceded each of the last eight recessions, with an average lead time of 12-18 months from initial inversion.
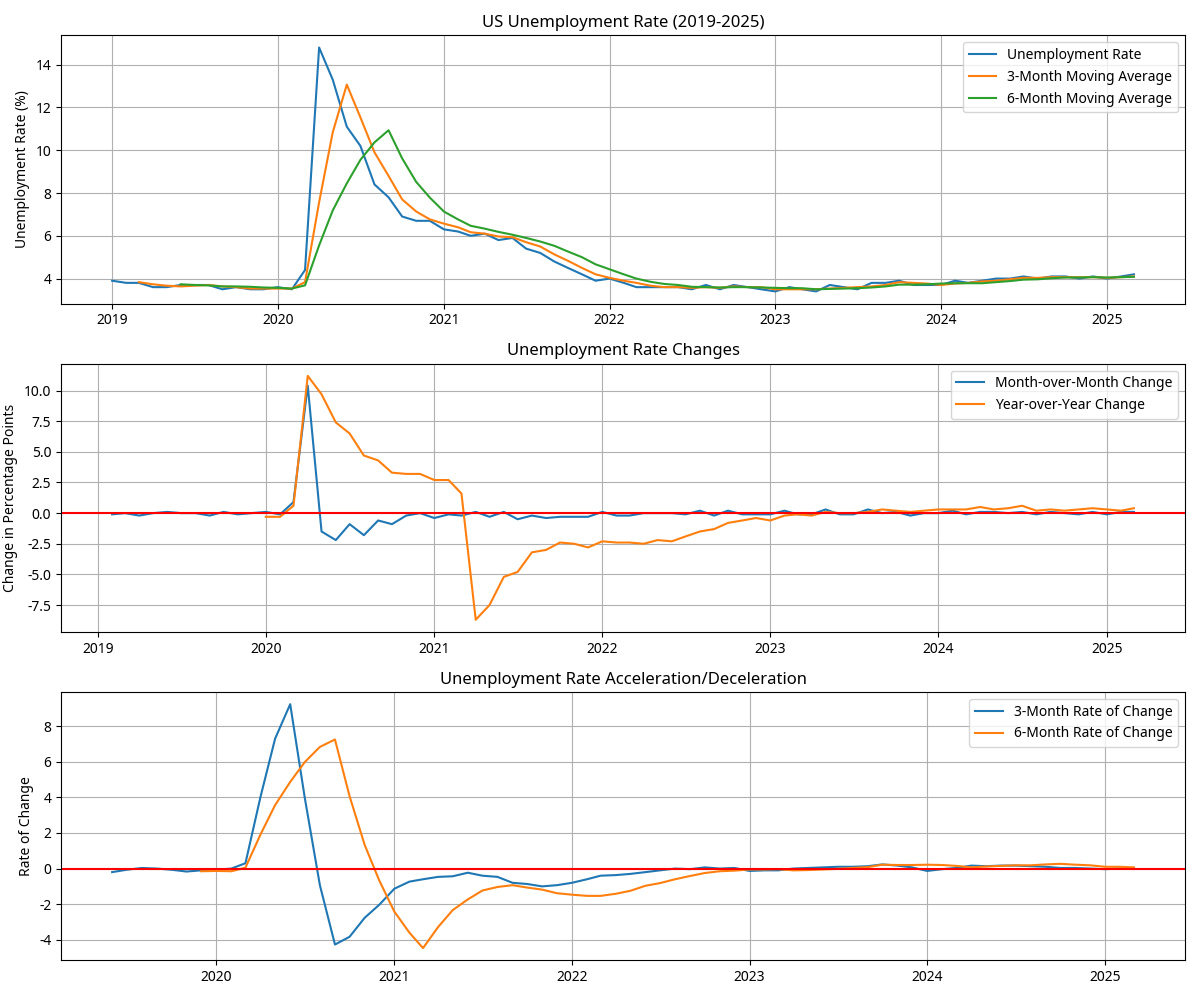
The current unemployment rate stands at 4.2% (March 2025), with two consecutive monthly increases and a year-over-year change of 0.4 percentage points.
While the Sahm Rule has not yet been triggered, the current value of 0.40 percentage points is approaching this threshold. Unemployment is typically a lagging indicator that rises more sharply once a recession is underway.
The Atlanta Fed GDPNow model estimates Q1 2025 GDP growth at -2.2%, representing a significant 4.6 percentage point decline from Q4 2024 (2.4%).
While a single quarter of negative growth does not constitute a recession by the traditional definition, it has historically been followed by recession about 60% of the time.
Consumer sentiment has plummeted to 50.8 in April 2025, down from 57.0 in March, representing a sharp 6.2-point monthly decline.
This level is significantly below historical recession thresholds and is 34.2 points below the historical average. Deteriorating consumer sentiment often precedes reductions in consumer spending.
Inflation has moderated to 2.4% in March 2025, down from 2.8% in February, representing a 0.4 percentage point monthly decline.
The rapid deceleration in inflation could indicate weakening demand, though it is also bringing inflation closer to the Federal Reserve's 2% target.
The S&P 500 has declined 13.6% from its recent peak of 6,143 to 5,310, and has touched bear market territory (defined as a 20% decline). This significant market correction suggests growing concerns about economic conditions.
Stock market signals have strengthened considerably as warning signs, with the sharp decline and increased volatility aligning with patterns seen before previous recessions.
Click "View Detailed Chart" on any indicator card to see detailed analysis
To provide context for the current economic situation, we compared current conditions to previous pre-recession periods:
The pattern of inversion followed by normalization has preceded each of the last 8 recessions. The average lead time between initial inversion and recession onset has been 12-18 months.
Before the 2001 recession, unemployment began rising gradually from a low of 3.8% before accelerating once the recession was underway. Similarly, before the 2007-2009 recession, unemployment began rising gradually from a low of 4.4% before accelerating sharply. The current pattern of gradual increases from a low level follows this historical pattern.
In the quarter preceding the 2001 recession, GDP growth slowed to 1.1% before turning negative. Before the 2007-2009 recession, GDP growth was 2.2% two quarters before turning negative. The current sharp deceleration to -2.2% is more severe than these historical examples.
Sharp declines in consumer sentiment preceded both the 2001 and 2007-2009 recessions. The current level and rate of decline is comparable to these historical episodes.
This assessment employed a weighted analysis of six key economic indicators, with weights assigned based on each indicator's historical predictive power for recessions. Data was collected from authoritative sources including the Federal Reserve, Bureau of Labor Statistics, Bureau of Economic Analysis, and University of Michigan.
For each indicator, a recession probability score (0-100%) was assigned based on current values, recent trends, and historical patterns preceding recessions. These scores were then weighted and combined to produce an overall recession probability estimate.
The weight of evidence across multiple economic indicators suggests an elevated risk of recession within the next 12 months. The combination of a recently normalized yield curve inversion, negative GDP growth, deteriorating consumer sentiment, and early signs of labor market weakness presents a concerning picture.
While some indicators (inflation, stock market) show less severe warning signs, the overall pattern is consistent with pre-recession conditions. The probability assessment of 75.8% reflects a significant recession risk that warrants close monitoring and prudent risk management.
It's important to note that economic forecasting involves inherent uncertainty, and policy interventions or unexpected positive developments could alter this outlook. However, based on the current data and historical patterns, the risk of a recession within the next 12 months is substantial.